How to Politely Crawl and Analyze Half a Billion Images
Building a high-performance distributed crawler with asyncio, Redis, and Kafka.
2020-09-01
Introduction
A few years ago, Creative Commons tasked me with building a web crawler capable of downloading 500 million images.
Crawling anything beyond a few thousand URLs demands a fast distributed system. Moreover, it's not enough to be fast; moral, legal, and practical considerations demand that a crawler be polite: a crawler must be carefully designed to avoid exhausting the resources of its targets. Finally, there is the matter of analyzing and indexing the dataset produced by the crawler. Achieving these aims on the scale of several hundred million images is a major challenge; the problems of rate limiting and task scheduling become far more difficult when state is spread across multiple nodes.
In this article, I discuss the process of designing, implementing, and deploying a large scale image crawler, with a few code snippets and diagrams along the way. The full source code is available on GitHub under the MIT License.
Background
With CC Search (now Openverse), Creative Commons (CC) set out to index all of the CC licensed works on the internet, starting with images. We indexed over 500 million images, which we believe is roughly 36% of all open content by our last count. Recently, we reached a point where improving the quality of the search results demanded crawling and analyzing a copy of every image in our system.
Originally, when we discovered an image and inserted it into CC Search, we didn't even bother downloading it; we stuck the URL in our database and embedded the image in our search results. This approach has a lot of problems:
- Embedding third party content is fraught. What if the other party's server goes down, the images disappear due to link rot, or a result's TLS certificate expires? Each of these situations results in broken images appearing in the search results or browser alerts about degraded security.
- The dimensions and compression quality of images are unknown. We have no way to lower the rank of poor quality images, and filtering our search results by resolution is impossible.
- Without the images themselves, it is not possible to perform more sophisticated analysis such as tagging.
We solved (1) by setting up a caching thumbnail proxy between images in the search results and their 3rd party origin, as well as some last-minute liveness checks to make sure that the image hasn't 404'd.
(2) and (3), however, are not possible to solve without actually downloading the image and performing some analysis on the contents of the file. To reproduce the features that users take for granted in image search, we're going to need a fairly powerful crawling system.
On the scale of several thousand images, it would be easy to cobble together a few scripts to spit out this information, but with half a billion images, there are a lot of hurdles to overcome.
- We want to crawl politely; however, the concentration and quantity of images means that we have to hit some sources with a high crawl rate in order to have any hope of finishing the crawl in a reasonable period of time. Our data sources range from non-profit museums with a single staff IT person to tech companies with their own data centers and thousands of employees; the crawl rate has to be tailored to download quickly from the big players but not overwhelm small sources. At the same time, we need to be sure that we are not overestimating any source's capacity and watch for signs that our crawler is straining the server.
- We need to keep the time to process each image as low as possible. This means that the crawling and analysis tasks need to be distributed to multiple machines in parallel.
- The crawler will produce a lot of metadata. Integrating it with our internal systems should not interfere with processing incoming metadata. That suggests that a message bus will be necessary to buffer messages before they are written into our data layer, where writes can be expensive.
- We need a way to understand how the crawl is progressing. We should have summaries of error counts, status codes, and crawl rates broken down by source.
In summary, the challenge isn't so much making a fast crawler as much as it is tailoring the crawl speed to each source. At a minimum, we'll need to deal with concurrency and parallelism, provisioning and managing the life cycle of crawler infrastructure, pipelines for capturing output data, a way to monitor the progress of the crawl, a suite of tests to make sure the system behaves as expected, and a reliable way to enforce a so-called "politeness policy". That's not a trivial project, particularly for our tiny three person tech team (of which only one person is available to do all of the crawling work). Can't we just use an off-the-shelf open source crawler?
What about existing open source crawlers?
Any decent software engineer will consider existing options before diving into a project and reinventing the wheel. My assessment was that although there are a lot of open source crawling frameworks available, few of them focus on images, some are not actively maintained, and all would require extensive customization to meet the requirements of our crawl strategy. Further, many solutions are more complex than than our use case demands and would significantly expand our use of cloud infrastructure, resulting in higher expenses and operational headaches. I experimented with Apache Nutch, Scrapy Cluster, and Frontera; none of the existing options looked quite right for this use case.
As a reminder, we want to eventually crawl every single Creative Commons work on the internet. Effective crawling is central to the capabilities that our search engine is able to provide. In addition to being central to achieving high quality image search, crawling could also be useful for discovering new Creative Commons content of any type on any website. In my view, that's a strong argument for spending some time designing a custom crawling solution where we have complete end-to-end control of the process, as long as the feature set is limited in scope. In the next section, we'll assess the effort required to build a crawler from the ground up.
Designing the crawler
We know we're not going to be able to crawl 500 million images with one virtual machine and a single IP address, so it is obvious from the start that we are going to need a way to distribute the crawling and analysis tasks over multiple machines. A basic queue-worker architecture will do the job: when we want to crawl an image, we can dispatch the URL to an inbound images queue, and a worker eventually pops that task out and processes it. Kafka will handle all of the hard work of partitioning and distributing the tasks between workers.
The worker processes do the actual analysis of the images, which entails downloading the image, extracting interesting properties, and sticking the resulting metadata back into a Kafka topic for later downstream processing. The worker will also have to include some instrumentation for conforming to rate limits and error reporting.
We also know that we will need to share some information about crawl progress between worker processes, such as whether we've exceeded our prescribed rate limit for a website, the number of times we've seen a status code in the last minute, how many images we've processed so far, and so on. Since we're only interested in sharing application state and aggregate statistics, a lightweight key-value store like Redis is a sensible choice.
Finally, we need a supervising process that centrally controls the crawl. This key governing process will be responsible for making sure our crawler workers are behaving properly by moderating crawl rates for each source, taking action in response to errors, and reporting statistics to the operators of the crawler. We'll call this process the crawl monitor.
Here's a rough sketch of how things will work:
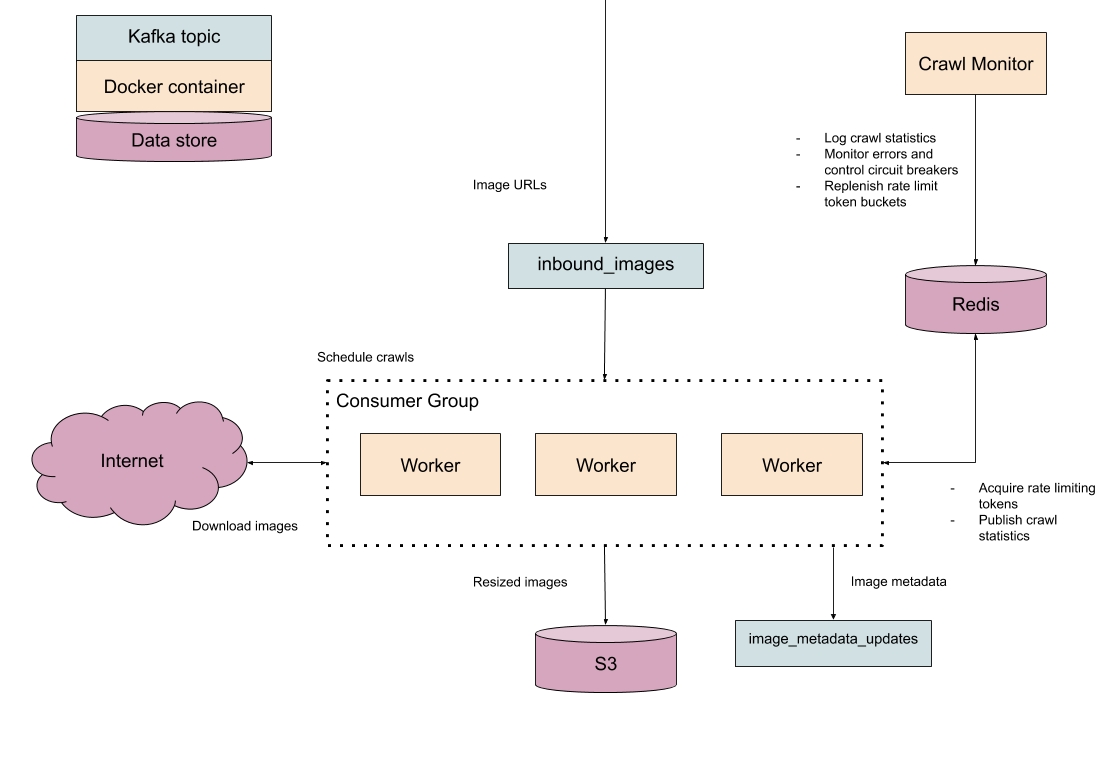
At a high level, the problem of building a fast crawler seems solvable for our team, even on the scale of several hundred million images. If we can sustain a crawl and analysis rate of 200 images per second, we could crawl all 500 million images in about a month.
Next, we'll examine some of the key components that make up the crawler.
Detailed breakdown
Concurrency with asyncio
Crawling is an I/O bound task. The workers need to maintain lots of simultaneous open connections with internal systems like Kafka and Redis as well as 3rd party websites holding the target images. Once we have the image in memory, performing our actual analysis task is easy and cheap. For these reasons, an asynchronous approach seems more attractive than using multiple threads of execution. Even if our image processing task grows in complexity and becomes CPU bound, we can get the best of both worlds by offloading heavyweight tasks to a process pool. See "Running Blocking Code" in the asyncio docs for more details.
Another reason that an asynchronous approach may be desirable is that we have several interlocking components which need to react to events in real-time: our crawl monitoring process needs to simultaneously control the rate limiting process and interrupt crawling if errors are detected, while our worker processes need to consume crawl events, process images, upload thumbnails, and produce events documenting the metadata of each image. Coordinating all of these components through inter-process communication could be difficult, but breaking up tasks into small pieces and yielding to the event loop is comparatively easy; we won't need to worry so much about tripping over Python's global interpreter lock or numerous other multithreading pitfalls.
The resize task
This is the most vital part of our crawling system: the part that actually does the work of fetching and processing an image. As established previously, we need to execute this task concurrently, so we need to make extensive use of the async and await keywords to allow the event loop to multitask. The actual task itself is otherwise straightforward:
- Download the remote image and load it into memory.
- Extract the resolution and compression quality.
- Thumbnail the image for later computer vision analysis and upload it to S3.
- Write the information we've discovered to a Kafka topic.
- Report success/errors to Redis in aggregate.
See image.py for the nitty-gritty details.
Rate limiting with token buckets and error circuit breakers
How do we determine the rate limit?
Often times, when designing highly concurrent software, the goal is to maximize the throughput and push servers to their absolute limit. The opposite is true with a web crawler, particularly when you are operating under a non-profit organization completely reliant on the goodwill of others to exist. We want to be as certain as reasonably possible that we aren't going to knock a resource off of the internet with an accidental DDoS. At the same time, we need to crawl as quickly as possible against sources with adequate resources to withstand a heavy crawl, or else we'll never finish. How can we match our crawl rate to a site's capabilities?
Originally, my plan was to determine this through an adaptive rate limiting strategy, where we would start with a low rate limit and use a hill climbing algorithm to determine the optimal rate. We could track metrics like time to first byte (TTFB) and bandwidth speed to determine the exact moment that we have started to strain upstream servers. A few concerns deterred me from implementing this design:
- The assumption that performance will steadily degrade is flawed. What if TTFB holds steady until suddenly the site goes down?
- How can we detect whether we are the cause of the performance issue? We could get stuck at a suboptimal rate limit due to normal fluctuations in traffic.
- Recording TTFB in Python requires low level access to connection data not readily exposed by
aiohttp.
Eventually, I realized this would be too much of a hassle and decided to use a simpler strategy.
It turns out that the size of a website is typically correlated with infrastructure capabilities. The reasoning behind this is that if you are capable of hosting 450MM images, you are probably able to handle at least a couple hundred requests per second for serving traffic. In our case, we already know how many images a source has, so it's easy for us to peg our rate limit between a low minimum for small websites and a reasonable maximum for large websites, and then interpolate everything in-between.
Of course, this is only a rough heuristic for approximating a site's capacity. We have to allow the possibility that we set our rate limit too aggressively in spite of our precautions.
Backing off with circuit breakers
If our heuristic fails to correctly approximate the bandwidth capabilities of a site, we are going to start encountering problems. For one, we might exceed the server-side rate limit, which means we will see 429 Rate Limit Exceeded and 403 Forbidden errors instead of the images we're trying to crawl. Worse yet, the upstream source might continue to happily serve requests while we suck up all of their traffic capacity, resulting in degraded quality for other users. Clearly, in either scenario, we need to either reduce our crawl rate or even give up crawling the source entirely if it appears that we are impacting their uptime.
To handle these situations, we have two tools in our toolbox: a sliding window recording the status code of each request made we've made to each domain in the last 60 seconds, and a list of the last 50 statuses for each website. If the number of errors in our one minute window exceed 10%, something is wrong; we should wait a minute before trying again. If we have encountered many errors in a row, however, that suggests that we're having trouble with a particular site, so we ought to give up crawling the source and raise an alert.
Workers can keep track of this information in sorted sets in Redis. For the sliding error window, we'll sort each request by its timestamp, which will make it easy and cheap for us to expire status codes beyond the sliding window interval. Maintaining a list of the last N response codes is even easier; we just stick the status code in a list associated with the source.
class StatsManager:
    def __init__(self, redis):
        self.redis = redis
        self.known_sources = set()

    @staticmethod
    async def _record_window_samples(pipe, source, status):
        """ Insert a status into all sliding windows. """
        now = time.monotonic()
        # Time-based sliding windows
        for stat_key, interval in WINDOW_PAIRS:
            key = f'{stat_key}{source}'
            await pipe.zadd(key, now, f'{status}:{time.monotonic()}')
            # Delete events from outside the window
            await pipe.zremrangebyscore(key, '-inf', now - interval)
        # "Last n requests" window
        await pipe.rpush(f'{LAST_50_REQUESTS}{source}', status)
        await pipe.ltrim(f'{LAST_50_REQUESTS}{source}', -50, -1)
Meanwhile, the crawl monitor process can keep tabs on the contents of each error threshold.
When more than 10% of the requests made to a source in the last minute are errors, we'll set a halt condition in Redis and stop replenishing rate limit tokens (more on that below).
now = time.monotonic()
one_minute_window = await redis.zrangebyscore(
    one_minute_window_key, '-inf', now - 60
)
errors = 0
success = 0
for status in one_minute_window:
    if status not in EXPECTED_STATUSES:
        errors += 1
    else:
        successful += 1
tolerance = ERROR_TOLERANCE_PERCENT / 100
if not successful or errors / successful > tolerance:
    await redis.sadd(TEMP_HALTED_SET, source)
For detecting more serious errors, where we've seen 50 failed requests in a row, we'll set a permanent halt condition. That will give us the chance to tune our software before resuming the crawl.
last_50_statuses_key = f'statuslast50req:{source}'
last_50_statuses = await redis.lrange(last_50_statuses_key, 0, -1)
if len(last_50_statuses) >= 50 and _every_request_failed(last_50_statuses):
    await redis.sadd(HALTED_SET, source)
In practice, keeping a sliding window for tracking error thresholds and setting reasonable crawl rates worked well enough that the circuit breaker never activated.
Enforcing rate limits with token buckets
It's one thing to set a policy for crawling; it's another thing entirely to actually enforce it. How can we coordinate our multiple crawling processes to prevent them from overstepping our rate limit?
The answer is to implement a distributed token bucket system. The idea behind this is that each crawler has to obtain a token from Redis before making a request. Every second, the crawl monitor sets a variable containing the number of requests that can be made against a source. Each crawler process decrements the counter before making a request. If the decremented result is above zero, the worker is cleared to crawl. Otherwise, the rate limit has been reached and we should wait until a token has been obtained.
The beauty of token buckets is their simplicity, performance, and resilience against failure. If our crawler monitor process dies, crawling halts completely; making a request is not possible without first acquiring a token. This fail-closed design is far more desirable than the guard rails completely disappearing with the crawl monitor and allowing unbounded crawling. Further, since decrementing a counter and retrieving the result is an atomic operation in Redis, there's no risk of race conditions and therefore no need for locking. The overhead of coordinating and blocking on every single request would rapidly bog down our crawling system.
To ensure that all crawling is performed at the correct speed, I wrapped aiohttp.ClientSession with a rate limited version of the class.
class RateLimitedClientSession:
    def __init__(self, aioclient, redis):
        self.client = aioclient
        self.redis = redis

    async def _get_token(self, source):
        token_key = f'{CURRTOKEN_PREFIX}{source}'
        tokens = int(await self.redis.decr(token_key))
        if tokens >= 0:
            token_acquired = True
        else:
            # Out of tokens
            await asyncio.sleep(1)
            token_acquired = False
        return token_acquired

    async def get(self, url, source):
        token_acquired = False
        while not token_acquired:
            token_acquired = await self._get_token(source)
        return await self.client.get(url)
Meanwhile, the crawl monitor process is filling up each bucket once per second.
Scheduling tasks somewhat intelligently
The final pitfall in the design of our crawler is that we want to crawl every single website at the same time at its prescribed rate limit. That sounds almost tautological, like something that we should be able to take for granted after implementing all of this logic for preventing our crawler from working too quickly, but it turns out our crawler's processing capacity itself is a limited and contentious resource. We can only schedule so many tasks simultaneously on each worker, and we need to ensure that tasks from a single website aren't starving other sources of crawl capacity.
For instance, imagine that each worker is able to handle 5000 simultaneous crawling tasks, and every one of those tasks is tied to a tiny website with a very low rate limit. That means that our entire worker, which is capable of handling hundreds of crawl and analysis jobs per second, is stuck making one request per second until some faster tasks appear in the queue.
In other words, we need to make sure that each worker process isn't jamming itself up with a single source. We have a scheduling problem. We've naively implemented first-come-first-serve and need to switch to a different scheduling strategy.
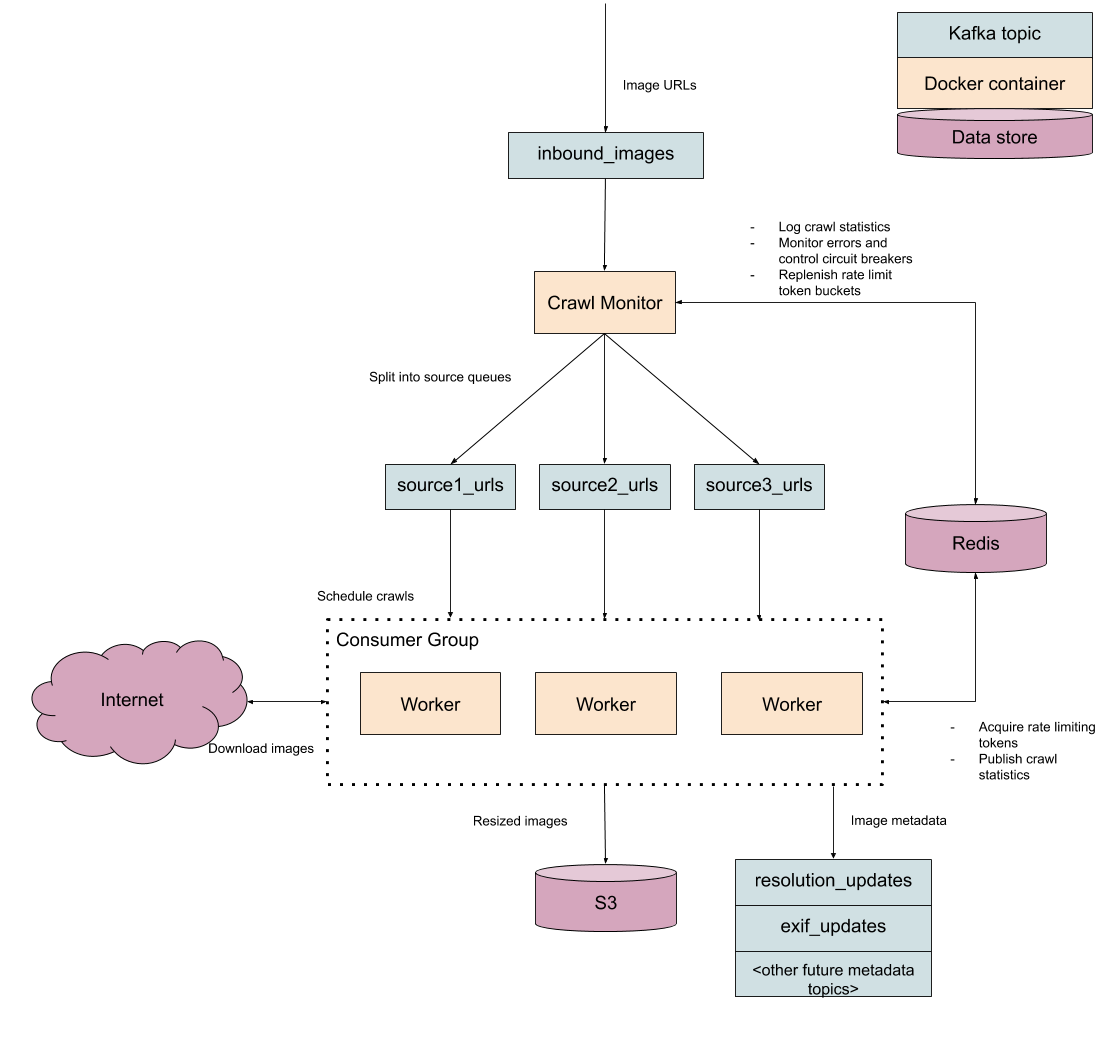
There are innumerable ways to address scheduling problems. Since there are only a few dozen sources in our system, we can get away with using a stupid scheduling algorithm: give each source equal capacity in every worker. In other words, if there are 5000 tasks to distribute and 30 sources, we can allocate 166 simultaneous tasks to each source per worker. That's plenty for our purposes. There are obvious drawbacks of this approach in that eventually there will be so many sources that we start starving high rate limit sources of work. We'll cross that bridge when we come to it; it's better to use the simplest possible approach we can get away with instead of spending all of our time on solving hypothetical future problems.
    async def _schedule(self, task_schedule):
        raw_sources = await self.redis.smembers('inbound_sources')
        sources = [str(x, 'utf-8') for x in raw_sources]
        num_sources = len(sources)
        # A source never gets more than 1/4th of the worker's capacity. This
        # helps prevent starvation of lower rate limit requests and ensures
        # that the first few sources to be discovered don't get all of the
        # initial task slots.
        max_share = settings.MAX_TASKS / 4
        share = min(math.floor(settings.MAX_TASKS / num_sources), max_share)
        to_schedule = {}
        for source in sources:
            num_unfinished = self._get_unfinished_tasks(task_schedule, source)
            num_to_schedule = share - num_unfinished
            consumer = self._get_consumer(source)
            source_msgs = self._consume_n(consumer, num_to_schedule)
            to_schedule[source] = source_msgs
        return to_schedule
The one implementation detail to deal with here is that our workers can't draw from a single inbound images queue anymore; we need to partition each source into its own queue so we can pull tasks from each source when we need it. This partitioning process can be handled transparently by the crawl monitor.
Designing for testability
It is difficult to test I/O-heavy systems because of their many interactions with external systems. Often times it is necessary to write complex integration tests or run manual tests to be certain that the software works. The problem is that integration tests are hard to maintain and take a long time to execute. Relying on integration tests exclusively would make maintaining the crawler far more difficult. Instead, we should build a suite of unit tests. How can we simulate the crawler realistically without writing a full-blown integration test suite?
The solution to this problem is to use dependency injection, which is a fancy way of saying that we never do I/O directly from within our application. Instead, we delegate I/O to external objects that can be passed in at run-time. This makes it easy to pass in fake objects that approximate real world behavior without real world consequences.
For example, the crawl monitor usually has to talk to our CC Search API (for assessing source size), Redis, and Kafka to do its job of regulating the crawl; instead of setting up a brittle and complicated integration test with all of those dependencies, we just instantiate some mock objects and pass them in. Now we can easily test individual components such as the error circuit breaker.
@pytest.fixture
def source_fixture():
    """ Mocks the /v1/sources endpoint response. """
    return [
        {
            "source_name": "example",
            "image_count": 5000000,
            "display_name": "Example",
            "source_url": "example.com"
        },
        {
            "source_name": "another",
            "image_count": 1000000,
            "display_name": "Another",
            "source_url": "whatever"
        }
    ]


def create_mock_monitor(sources):
    response = FakeAioResponse(status=200, body=sources)
    session = FakeAioSession(response=response)
    redis = FakeRedis()
    regulator_task = asyncio.create_task(rate_limit_regulator(session, redis))
    return redis, regulator_task


@pytest.mark.asyncio
async def test_error_circuit_breaker(source_fixture):
    sources = source_fixture
    redis, monitor = create_mock_monitor(sources)
    redis.store['statuslast50req:example'] = [b'500'] * 50
    redis.store['statuslast50req:another'] = [b'200'] * 50
    await run_monitor(monitor_task)
    assert b'example' in redis.store['halted']
    assert b'another' not in redis.store['halted']
The main drawback of dependency injection is that initializing your objects will take some more ceremony. See the initialization of the crawl scheduler for an example of wiring up an object with a lot of dependencies. You might also find that constructors will have a lot of arguments if care isn't taken to bundle external dependencies together. In my opinion, the price of a few extra lines of initialization code is well worth the benefits gained from testability and modularity, and number of arguments can be pared down with data classes.
Smoke testing
Even with our unit test coverage, we still need to do some basic small-scale manual tests to make sure our assumptions hold up in the real world. We'll need to write Terraform modules that provision a working version of the real system. Sadly, our Terraform infrastructure repository is private for now, but here's a taste of what the infra code looks like.
module "image-crawler" {
  source = "../../modules/services/image-crawler"
  environment = "prod"
  docker_tag = "0.25.0"
  aws_access_key_id     = "${var.aws_access_key_id}"
  aws_secret_access_key = "${var.aws_secret_access_key}"
  zookeeper_endpoint = "${module.kafka.zookeeper_brokers}"
  kafka_brokers = "${module.kafka.kafka_brokers}"
  worker_instance_type = "m5.large"
  worker_count = 5
}
resource "aws_instance" "crawler-workers" {
  ami                     = "${var.ami}"
  instance_type           = "${var.worker_instance_type}"
  user_data               = "${data.template_file.worker_init.rendered}"
  subnet_id               = "${element(data.aws_subnet_ids.subnets.ids, 0)}"
  vpc_security_group_ids  = ["${aws_security_group.image-crawler-sg.id}"]
  count                   = "${var.worker_count}"

  tags {
    Name             = "image-crawler-worker-${var.environment}"
    environment      = "${var.environment}"
    "cc:environment" = "${var.environment == "dev" ? "staging" : "production"}"
    "cc:product"     = "cccatalog-api"
    "cc:purpose"     = "Image crawler worker"
    "cc:team"        = "cc-search"
  }
}

resource "aws_instance" "crawler-monitor" {
  ami                     = "${var.ami}"
  instance_type           = "c5.large"
  user_data               = "${data.template_file.monitor_init.rendered}"
  subnet_id               = "${element(data.aws_subnet_ids.subnets.ids, 0)}"
  vpc_security_group_ids  = ["${aws_security_group.image-crawler-sg.id}"]

  tags {
    Name             = "image-crawler-monitor-${var.environment}"
    environment      = "${var.environment}"
    "cc:environment" = "${var.environment == "dev" ? "staging" : "production"}"
    "cc:product"     = "cccatalog-api"
    "cc:purpose"     = "Image crawler monitor"
    "cc:team"        = "cc-search"
  }
}
One terraform plan and terraform apply cycle later, we're ready to feed a few million test URLs to the inbound image queue and see what happens. By my recollection, testing uncovered many glaring issues:
- Basic network security configuration problems prevented communication between key components.
- The scheduling algorithm had to be completely overhauled.
- Workers exceeded the Redis maximum connection limit.
- Workers crashed due to hitting open file limit.
- A nasty memory leak in the
pykafkaconsumer prompted a late switch toconfluent-kafka
After patching all of those issues and performing a larger smoke test, we're ready to start crawling on a large scale.
Monitoring the crawl
Regrettably, we can't just kick back and relax while the crawler does its thing for a few weeks. We need some idea of what the crawler is doing so we can be alerted when something breaks.
How quickly are we crawling each website? What's our target rate limit for each source? How many errors have occurred? How many images have we successfully processed? Are we crawling right now, or are we finished?
Ideally, we would build a reporting dashboard for this, but in the interest of time, we'll dump a giant JSON blob to STDOUT every 5 seconds and call it a day. When we want to check on crawl progress, we read the logs. Since JSON is both trivially human and machine readable, we can easily build a more sophisticated monitoring system later should the need for that arise.
Here's an example log line from one of our smoke tests, indicating that we've crawled 13,224 images successfully and nothing else is happening.
{
   "event" : "monitoring_update",
   "time" : "2020-04-17T20:22:56.837232",
   "general" : {
      "global_max_rps" : 193.418869804698,
      "error_rps" : 0,
      "processing_rate" : 0,
      "success_rps" : 0,
      "circuit_breaker_tripped" : [],
      "num_resized" : 13224,
      "resize_errors" : 0,
      "split_rate" : 0
   },
   "specific" : {
      "flickr" : {
         "successful" : 13188,
         "last_50_statuses" : {
            "200" : 50
         },
         "rate_limit" : 178.375147633876,
         "error" : 0
      },
      "animaldiversity" : {
         "last_50_statuses" : {
            "200" : 18
         },
         "successful" : 18,
         "error" : 0,
         "rate_limit" : 0.206215440554406
      },
      "phylopic" : {
         "rate_limit" : 0.2,
         "error" : 0,
         "successful" : 18,
         "last_50_statuses" : {
            "200" : 18
         }
      }
   }
}
Now that we can see what the crawler is up to, we can schedule the larger crawl and start collecting production quality data.
Results
The result of our efforts is a lightweight, modular, highly concurrent, and polite distributed image crawler with only a handful of lines of code.
alden:~/code/image_crawler$ cloc .
      48 text files.
      43 unique files.
      25 files ignored.

github.com/AlDanial/cloc v 1.81  T=0.02 s (1667.4 files/s, 130887.8 lines/s)
------------------------------------------------------------------------------
Language                     files          blank        comment           code
------------------------------------------------------------------------------
Python                          16            244            242           1324
Markdown                         5             79              0            219
YAML                             3              2              4             61
XML                              3              0              0             18
Bourne Shell                     1              0              1              4
------------------------------------------------------------------------------
SUM:                            28            325            247           1626
------------------------------------------------------------------------------

alden:~/code/image_crawler$ tree .
.
├── architecture.png
├── CODE_OF_CONDUCT.md
├── CONTRIBUTING.md
├── crawl_monitor
│   ├── __init__.py
│   ├── monitor.py
│   ├── rate_limit.py
│   ├── README.md
│   ├── settings.py
│   ├── source_splitter.py
│   ├── structured_logging.py
│   └── tsv_producer.py
├── docker-compose.yml
├── Dockerfile-monitor
├── Dockerfile-worker
├── __init__.py
├── LICENSE
├── Pipfile
├── Pipfile.lock
├── publish_release.sh
├── README.md
├── test
│   ├── corrupt.jpg
│   ├── __init__.py
│   ├── mocks.py
│   ├── test_image.jpg
│   ├── test_monitor.py
│   └── test_worker.py
└── worker
    ├── image.py
    ├── __init__.py
    ├── message.py
    ├── rate_limit.py
    ├── scheduler.py
    ├── settings.py
    ├── stats_reporting.py
    └── util.py

3 directories, 34 files
We now have loads of useful information about images that we were initially lacking. The next step is to take this metadata and integrate it into our search engine, as well as perform deeper analysis of images using computer vision.
Acknowledgments & Legal
I'd like to give a special thanks to my colleagues at Creative Commons who took the time to review this article and give useful feedback, including Brent Moran, Kriti Godey, and Zack Krida.
This article was originally published on the Creative Commons Open Source Blog on August 17th, 2020. The version appearing on this page has been revised and expanded. It was written by Alden Page and released under a Creative Commons Attribution 4.0 International license.
✉️ Contact the author Subscribe to RSS feed